Where the sample student sits on the curve
Domain at or above averageDomain below average (SS < 90)Average range (SS 90–109, 25th–73rd pct)
①
Cognitive-domain profile
Standard score (mean 100, SD 15) with a 90% confidence band per domain. Composite scores only — no subtests, no names.
②
Strengths & needs summary
Generated from the profile: relative strengths are ≥ 1 SD above the student's own mean; needs sit below the average range.
Relative strengths
Areas of need
③
Minutes per report
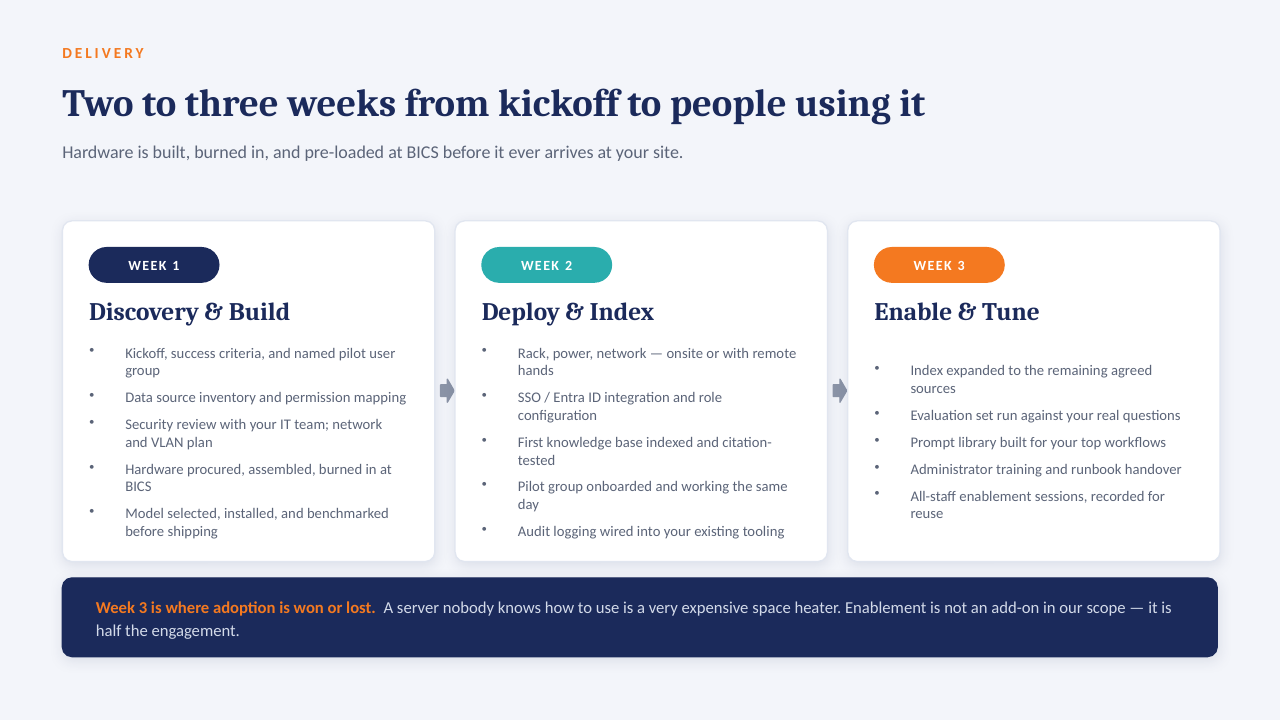
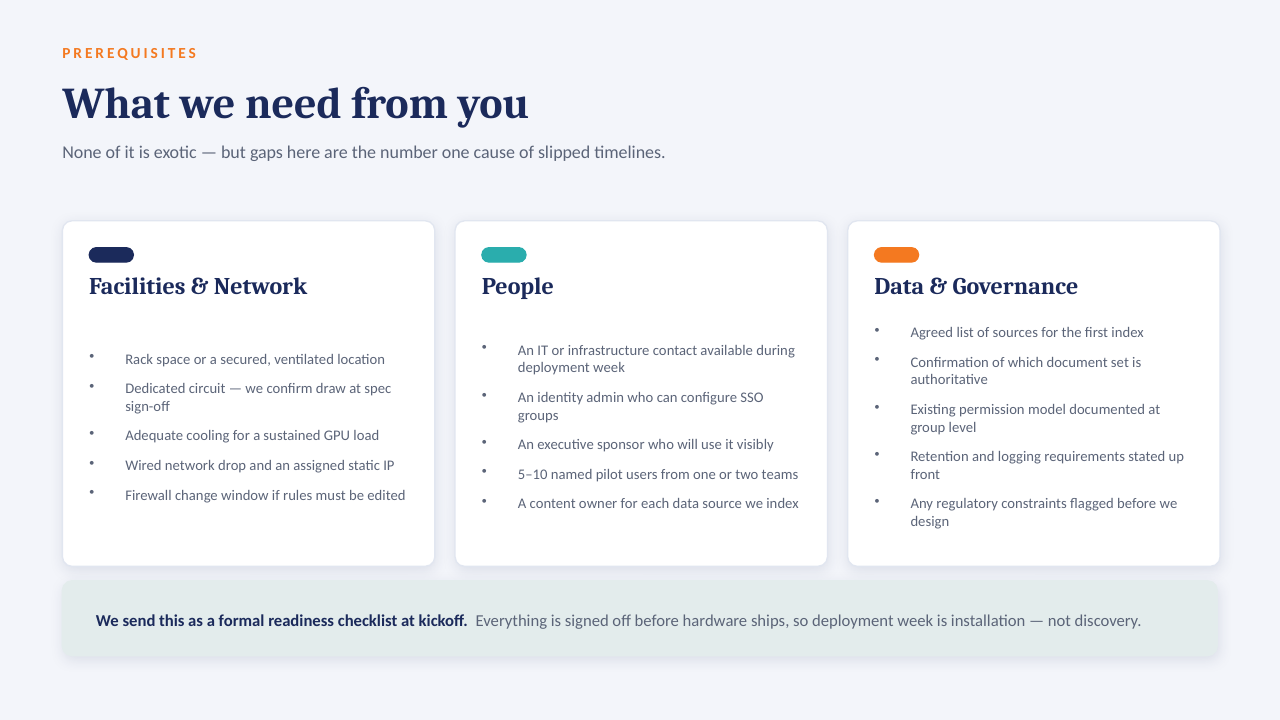
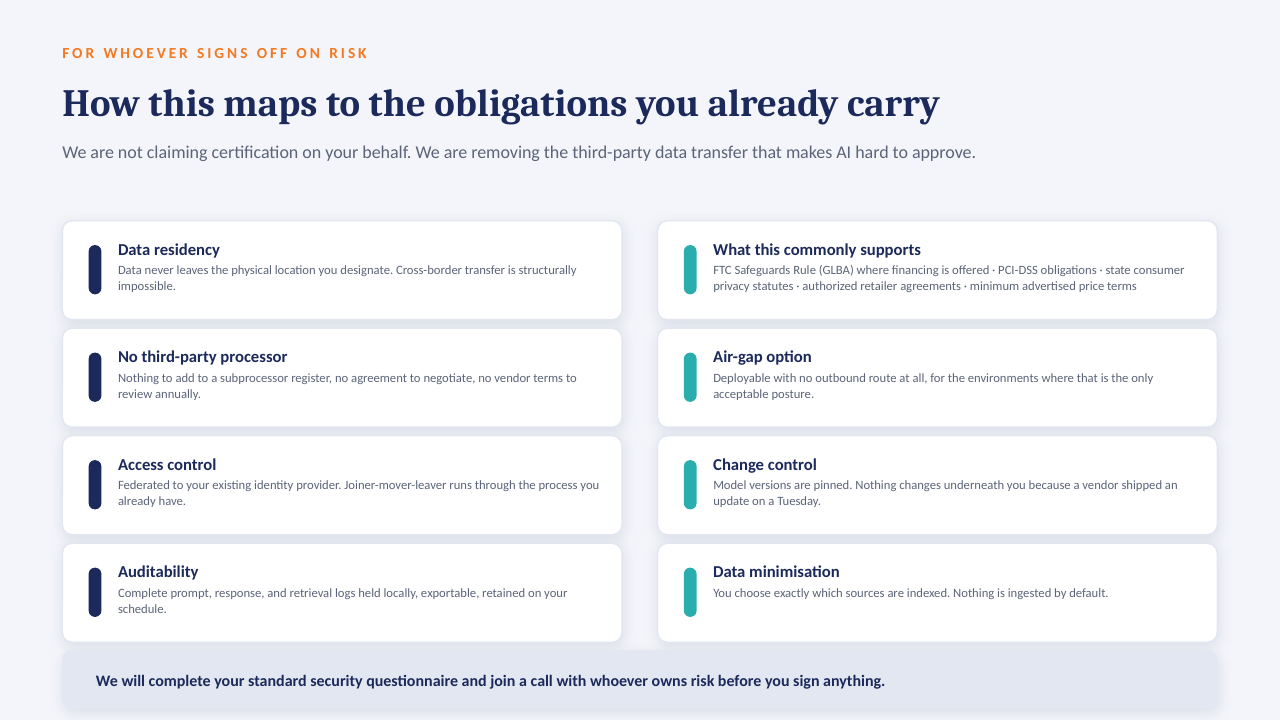
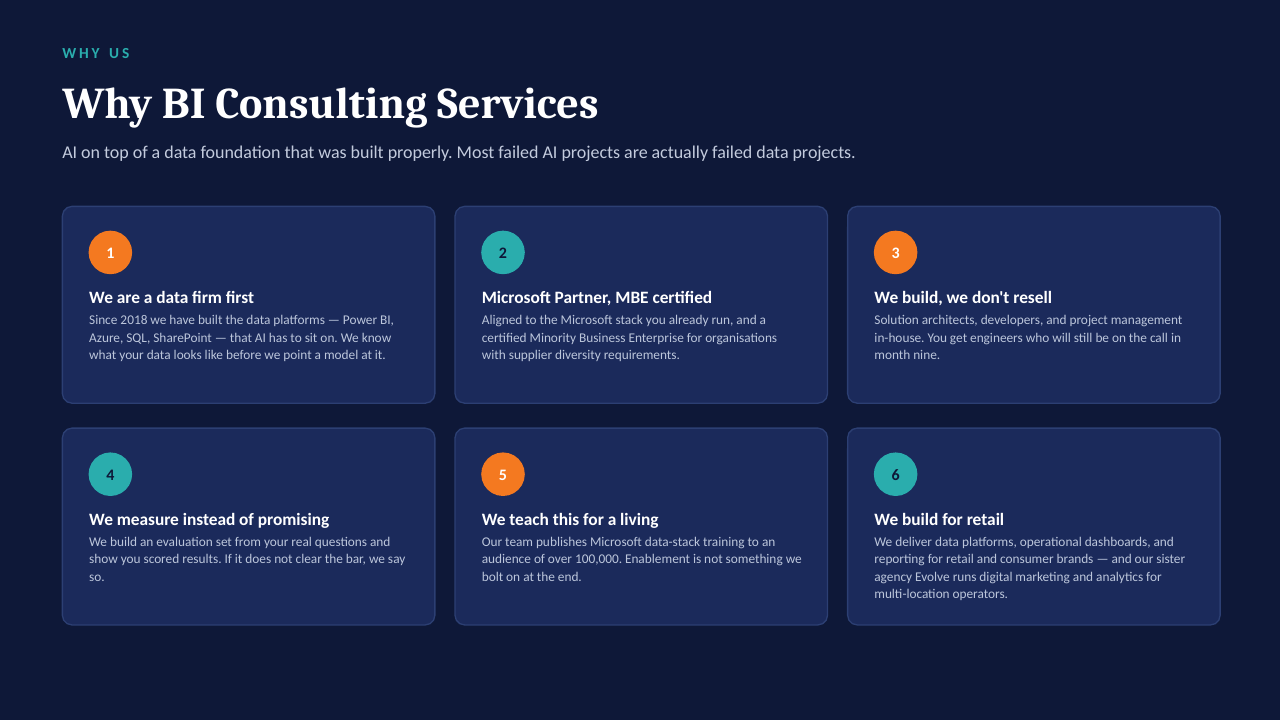
Today's Excel template vs the generated template — illustrative estimates, to be replaced with Anny's own timings.
Today · Excel
95min
→
Generated · Power BI
12min
④
Evaluations completed per month
Report delivered, by grade band of the student. Practice view — illustrative volumes for a solo practice.
⑤
Turnaround: last testing day → report sent
Median calendar days per month. The generated template removes the chart-building step, not the clinical writing.
⑥
Referral sources
Where evaluations in the period came from. Categories reflect a Manhattan pediatric practice; counts are illustrative.
⑦
Ask the data
A private assistant over the same model — answers cite the report section they came from. Static mock-up.
›Summarise this student's relative strengths in two sentences.